
Observability is critical in distributed systems. When you’re running microservices that communicate through Kafka and rely on Apicurio Registry for schema management, understanding the complete request flow becomes essential for debugging and performance optimization. In this post, we introduce comprehensive OpenTelemetry support in Apicurio Registry and provide a complete example demonstrating end-to-end distributed tracing.
What is OpenTelemetry?
OpenTelemetry (OTel) is a vendor-neutral observability framework that provides APIs, SDKs, and tools for collecting telemetry data including traces, metrics, and logs. It has become the industry standard for instrumenting distributed systems.
Distributed tracing allows you to follow a request as it travels through multiple services, making it invaluable for:
- Debugging: Identify where failures occur in a multi-service flow
- Performance analysis: Find bottlenecks across service boundaries
- Dependency mapping: Understand how services interact
- Root cause analysis: Trace issues back to their origin
OpenTelemetry in Apicurio Registry
Apicurio Registry is built with all OpenTelemetry signals enabled at build time (traces, metrics, and logs). However, the OTel SDK is disabled by default at runtime to avoid any performance impact for users who don’t need observability.
To enable OpenTelemetry, simply set:
QUARKUS_OTEL_SDK_DISABLED=false
Once enabled, Registry operations such as schema registration, lookup, and validation will generate spans that integrate seamlessly with your existing distributed traces.
Architecture Overview
The following diagram shows how traces flow through a typical setup with Kafka and Apicurio Registry:
┌─────────────────┐     ┌─────────────────┐     ┌─────────────────┐
│  Quarkus        │────▶│     Kafka       │────▶│    Quarkus      │
│  Producer       │     │   (Strimzi)     │     │    Consumer     │
└────────┬────────┘     └─────────────────┘     └────────┬────────┘
         │                                               │
         │              ┌─────────────────┐              │
         └─────────────▶│   Apicurio      │◀─────────────┘
                        │   Registry      │
                        │  (OTel enabled) │
                        └────────┬────────┘
                                 │
                        ┌────────▼────────┐
                        │   OpenTelemetry │
                        │   Collector     │
                        └────────┬────────┘
                                 │
                        ┌────────▼────────┐
                        │     Jaeger      │
                        │  (Visualization)│
                        └─────────────────┘
The key components are:
- Producer Application: Sends Avro messages to Kafka, registering schemas with Apicurio Registry
- Consumer Application: Consumes messages from Kafka, looking up schemas from Registry
- Apicurio Registry: Provides schema storage and validation with OTel instrumentation
- OpenTelemetry Collector: Aggregates and forwards telemetry data
- Jaeger: Visualizes the distributed traces
Trace Propagation
One of the most powerful features of OpenTelemetry is automatic context propagation. When properly configured, trace context flows seamlessly across service boundaries:
Kafka Message Propagation
The OpenTelemetry instrumentation for Kafka automatically:
- Producer side: Injects trace context (trace ID, span ID) into Kafka message headers
- Consumer side: Extracts trace context from Kafka message headers and creates child spans
This creates a continuous trace from producer through Kafka to consumer.
Registry Correlation
When producer or consumer applications communicate with Apicurio Registry:
- HTTP client instrumentation propagates trace context in HTTP headers
- Registry operations (schema registration, lookup) appear as child spans
- Schema caching behavior becomes visible in trace timing (first calls are slower, subsequent calls faster due to caching)
Complete Example
We’ve created a comprehensive example demonstrating end-to-end distributed tracing. The example includes Docker Compose and Kubernetes deployments, making it easy to try locally or in a cluster.
Quick Start with Docker Compose
1. Clone and build
# From the apicurio-registry repository
cd examples/otel-tracing

# Build producer
cd producer && mvn clean package -DskipTests && cd ..

# Build consumer
cd consumer && mvn clean package -DskipTests && cd ..
2. Start the infrastructure
docker compose up -d
3. Access the services
| Service | URL |
|---|---|
| Jaeger UI | http://localhost:16686 |
| Apicurio Registry | http://localhost:8083 |
| Producer API | http://localhost:8084 |
| Consumer API | http://localhost:8085 |
4. Generate traces
Send a greeting message through the system:
# Send a message
curl -X POST "http://localhost:8084/greetings?name=World"

# Consume the message
curl "http://localhost:8085/consumer/greetings"
5. View traces in Jaeger
Open http://localhost:16686 and:
- Select a service:
greeting-producer,greeting-consumer, orapicurio-registry - Click “Find Traces”
- Click on a trace to see the complete flow across all services
Understanding Trace Visualization and Performance Analysis
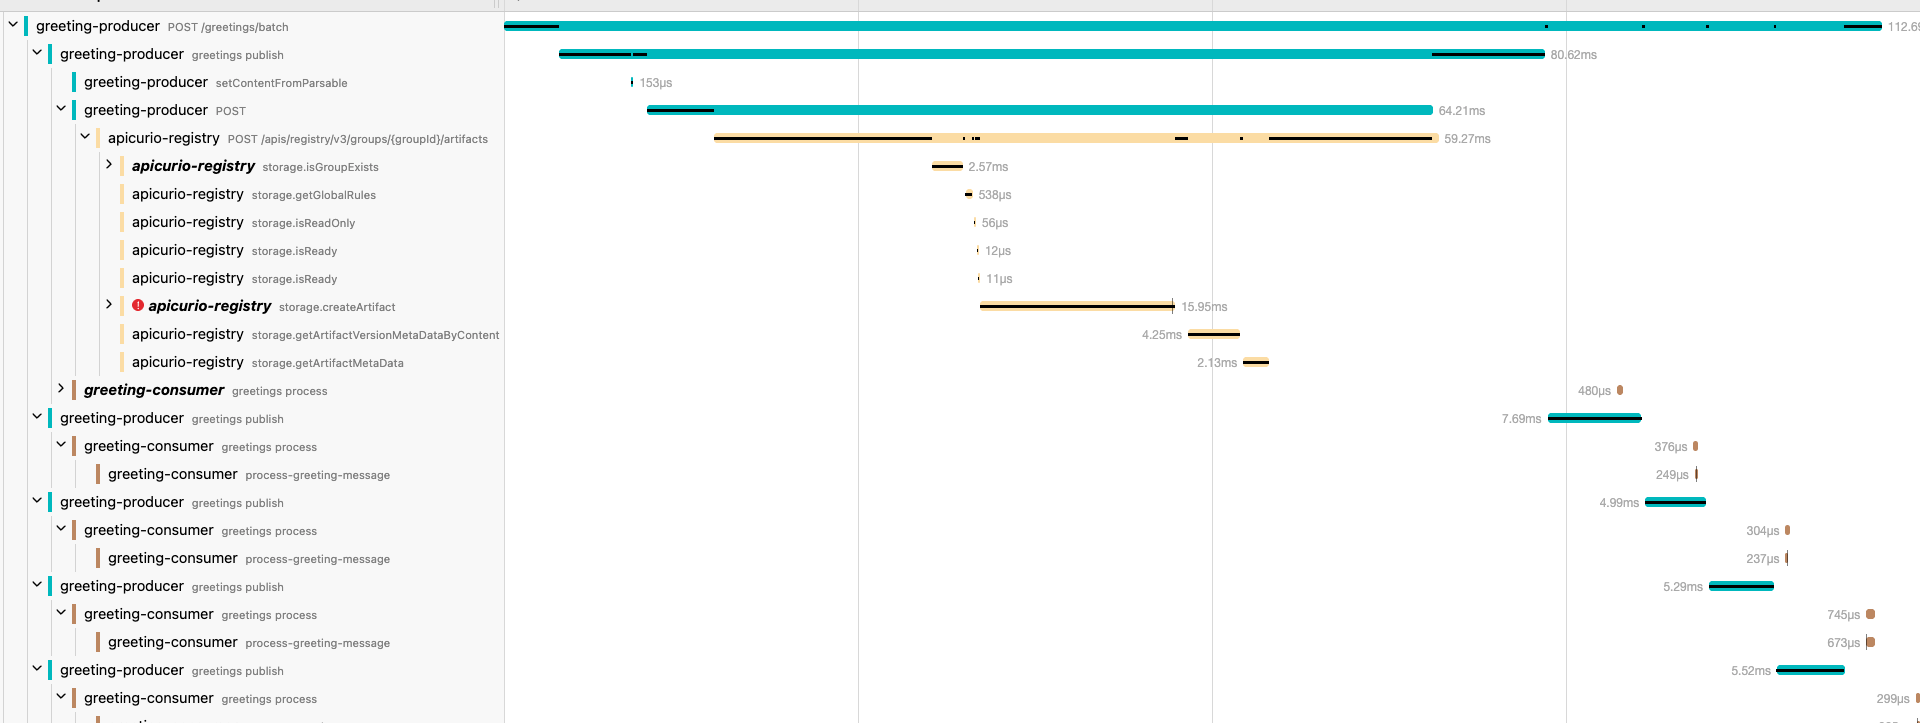
When you open a trace in Jaeger, you get a powerful view into exactly how your distributed system behaves. The following screenshot shows a real trace from the batch greeting endpoint:
Reading the Trace
The trace visualization displays a hierarchical timeline where:
- Each row represents a span - a unit of work within a service
- Indentation shows parent-child relationships - child spans are nested under their parents
- Bar length indicates duration - longer bars mean more time spent
- Bar position shows timing - when each operation started relative to the trace
In this example trace, you can see the complete flow:
greeting-producer POST /greetings/batch(112.6ms total) - The incoming HTTP requestgreeting-producer greetings publish(80.62ms) - Publishing messages to Kafkaapicurio-registry POST /apis/registry/v3/groups/{groupId}/artifacts(59.27ms) - Schema registration call to Registry
The Registry span expands to show internal storage operations:
| Operation | Duration | Purpose |
|---|---|---|
storage.isGroupExists |
2.57ms | Check if the artifact group exists |
storage.getGlobalRules |
538µs | Retrieve global validation rules |
storage.isReadOnly |
56µs | Check if registry is in read-only mode |
storage.isReady |
12µs | Health check |
storage.createArtifact |
15.95ms | Create the new artifact (most expensive) |
storage.getArtifactVersionMetaDataByContent |
4.25ms | Retrieve version metadata |
storage.getArtifactMetaData |
2.13ms | Get artifact metadata |
Using Traces for Performance Optimization
This level of detail enables powerful performance analysis:
Identify Bottlenecks
The trace immediately reveals where time is spent. In this example, storage.createArtifact takes 15.95ms - the largest portion of the Registry call. If you’re experiencing slow schema registrations, this pinpoints exactly which operation to investigate.
Measure Latency Breakdown
You can calculate the percentage of time each component contributes:
- Producer processing: ~20% of total time
- Network + Kafka: ~10%
- Registry operations: ~53%
- Consumer processing: ~17%
Detect Caching Effects
Notice how subsequent consumer operations (greetings process) take only 480µs compared to the initial 7.69ms. This demonstrates schema caching in action - once a schema is fetched from Registry, it’s cached locally, dramatically reducing latency for subsequent messages.
Compare Across Requests
Jaeger allows you to compare traces side-by-side. You can:
- Compare slow vs. fast requests to identify anomalies
- Track performance trends over time
- Validate that optimizations have the expected impact
Set Performance Baselines
By collecting traces over time, you can establish baseline performance metrics:
- P50/P95/P99 latencies for Registry operations
- Expected duration for schema registration vs. lookup
- Acceptable overhead for distributed tracing itself
This data helps you set meaningful SLOs and alerts for your schema registry infrastructure.
Custom Span Creation
The example demonstrates two approaches to creating custom spans for your own applications:
Declarative Approach with @WithSpan
@WithSpan("create-greeting")
private Greeting createGreeting(
        @SpanAttribute("greeting.recipient") String name,
        @SpanAttribute("greeting.trace_id") String traceId) {

    Span.current().setAttribute("greeting.source", "greeting-producer");
    Span.current().addEvent("greeting-object-created");
    // Business logic here
    return greeting;
}
Programmatic Approach with Tracer API
Span processSpan = tracer.spanBuilder("process-detailed-greeting")
        .setSpanKind(SpanKind.INTERNAL)
        .setAttribute("greeting.recipient", name)
        .setAttribute("greeting.priority", priority)
        .startSpan();

try (Scope scope = processSpan.makeCurrent()) {
    processSpan.addEvent("validation-started");
    // Business logic here
    processSpan.addEvent("validation-completed");
    processSpan.setStatus(StatusCode.OK);
} finally {
    processSpan.end();
}
Error Tracing
The example includes dedicated endpoints for demonstrating error tracing:
# Test different error types
curl -X POST "http://localhost:8084/greetings/invalid?errorType=validation"
curl -X POST "http://localhost:8084/greetings/invalid?errorType=schema"
curl -X POST "http://localhost:8084/greetings/invalid?errorType=kafka"
Error spans in Jaeger appear with:
- Red color indicating error status
- Exception stack traces in span logs
- Custom error attributes and events
Sampling Strategies
The example uses parentbased_always_on sampling (100% of traces), which is ideal for development. For production environments, consider these alternatives:
| Strategy | Description | Use Case |
|---|---|---|
always_on |
Sample all traces | Development |
parentbased_traceidratio |
Sample a percentage with parent inheritance | Production |
always_off |
Disable tracing | When not needed |
Configure sampling via environment variables:
QUARKUS_OTEL_TRACES_SAMPLER: "parentbased_traceidratio"
QUARKUS_OTEL_TRACES_SAMPLER_ARG: "0.1"  # 10% sampling
Configuration Reference
Apicurio Registry OpenTelemetry Properties
| Property | Description | Default |
|---|---|---|
quarkus.otel.sdk.disabled |
Disable/enable OTel SDK at runtime | true |
quarkus.otel.service.name |
Service name in traces | Application name |
quarkus.otel.exporter.otlp.endpoint |
OTLP collector endpoint | http://localhost:4317 |
quarkus.otel.exporter.otlp.protocol |
OTLP protocol (grpc or http/protobuf) | grpc |
quarkus.otel.traces.sampler.arg |
Sampler ratio (0.0 to 1.0) | 0.1 |
Important: Signal properties (traces.enabled, metrics.enabled, logs.enabled) are build-time properties. Use quarkus.otel.sdk.disabled for runtime control.
Kubernetes Deployment
The example also includes complete Kubernetes manifests for deployment with Strimzi. Key steps:
- Install Strimzi operator
- Build and push container images
- Deploy with
kubectl apply -k k8s/ - Port-forward to access services
See the example README for detailed Kubernetes instructions.
Troubleshooting
No traces appearing in Jaeger
- Check OTel Collector logs:
docker compose logs otel-collector - Verify OTLP endpoint configuration
- Ensure
QUARKUS_OTEL_SDK_DISABLED=falseis set for Apicurio Registry
Missing trace context in consumer
- Ensure both
quarkus-opentelemetryandquarkus-kafka-clientdependencies are present - Check Kafka message headers for trace context
- Verify OTel is enabled in both producer and consumer
Schema registration failures
- Check Registry health:
curl http://localhost:8083/health - Verify Registry URL in application configuration
- Check network connectivity between services
Conclusion
OpenTelemetry support in Apicurio Registry enables powerful observability capabilities for your schema registry operations. Combined with the new example demonstrating end-to-end distributed tracing with Kafka, you now have everything needed to implement comprehensive observability in your event-driven architectures.
The example is available in the Apicurio Registry repository under examples/otel-tracing. We encourage you to try it out and provide feedback!
For more details, check: